Reverse engineering · 3D modelling · Structural characterization
Digital model of a Nordex N80 wind turbine
Reverse-engineered digital reconstruction of a 2.5 MW wind turbine installed at the Burgar Hill wind farm (Orkney Islands, Scotland). The model integrates geometry captured by laser scanning, aerodynamic characterization of the blade, and structural properties of tower and blades — all validated against 12 months of real operational data from the wind farm.
Starting point
The wind turbine in this study is a Nordex N80 HH58 rated at 2.5 MW, with an 80-metre rotor and a 58-metre tower. The manufacturer's original technical documentation was not available, so any subsequent analysis (life extension, performance optimization, repowering) required building a reliable geometric, aerodynamic, and structural model from scratch.
The goal was clear: produce a model capable of reproducing the actual behaviour of the machine with less than 10% deviation from operational data, working only from in-situ measurements and public data on similar equipment.
Geometric capture
The full geometry of the wind turbine was captured with a Leica ScanStation P40 laser scanner, performing scans from multiple positions around the base to cover tower, nacelle, hub and blades. The partial point clouds were registered and merged in Cyclone 3DR with a mean registration error below 4 mm. Tower wall thickness, not accessible from the outside, was completed with ultrasonic measurements at different heights.
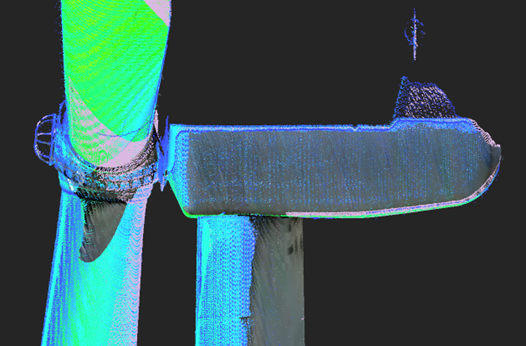
The height of the turbine (58 m) and the presence of wind during the capture introduced two challenges: areas of lower point density at the top, and residual oscillations of the blades, particularly noticeable towards the tip. To correct these effects, a filtering algorithm in Python was developed to stabilize the cross-section of the blade before extracting geometric parameters.
Blade modelling
The blade is the most geometrically complex element of a wind turbine. From the point cloud, the blade was segmented into 30 sections along its span. For each section, automated Python processing extracted the parameters that define the aerodynamic profile: chord length, twist angle, absolute and relative thickness, and prebend.
Each section was then matched against a database of more than 1,600 aerodynamic profiles using a least-squares algorithm, identifying the closest standard profile. The resulting profiles belong mainly to the NACA 63 and Wortmann FX families, consistent with commercial blades on wind turbines of similar power.
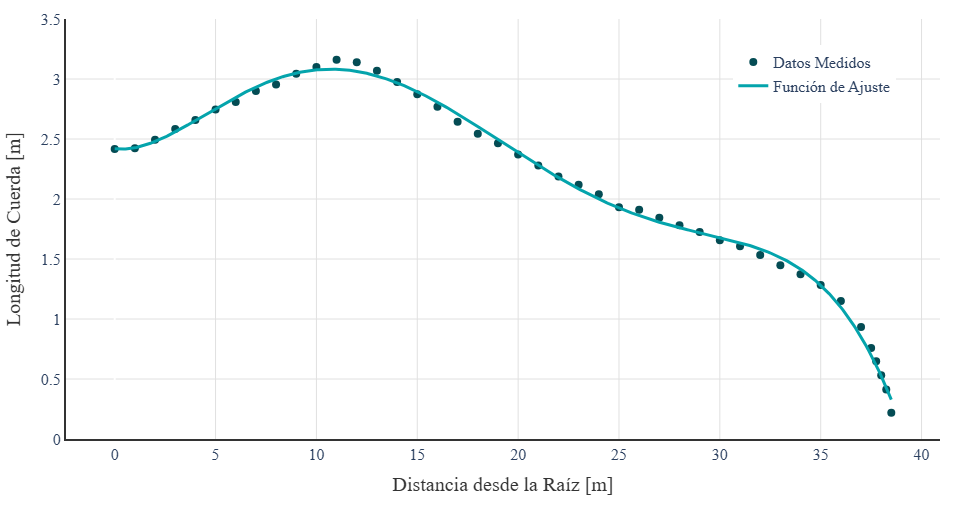
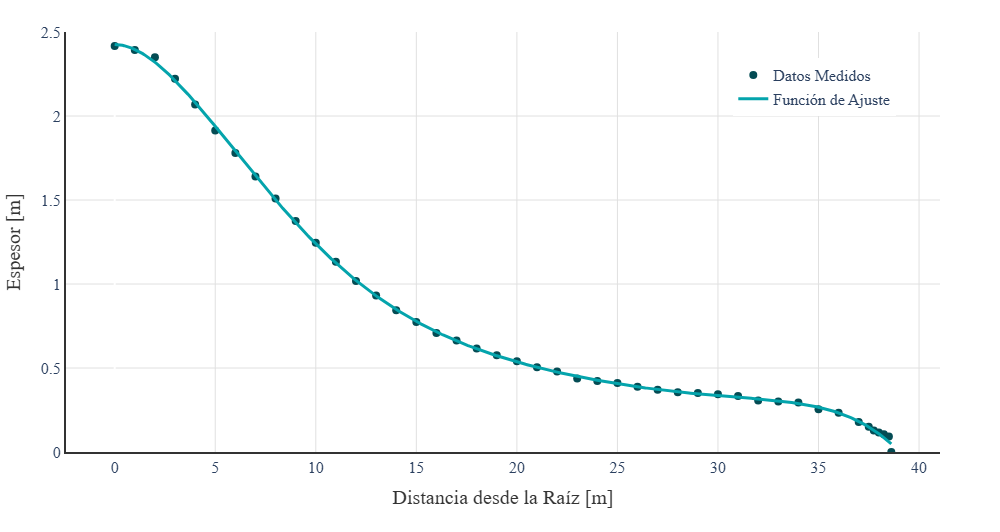
Chord, thickness, and prebend distributions were approximated by 6th-degree polynomial functions with a coefficient of determination R² above 0.998. These functions feed into the simulation model, replacing the discrete data with a continuous analytical representation that is easier to handle and trace.
Structural characterization
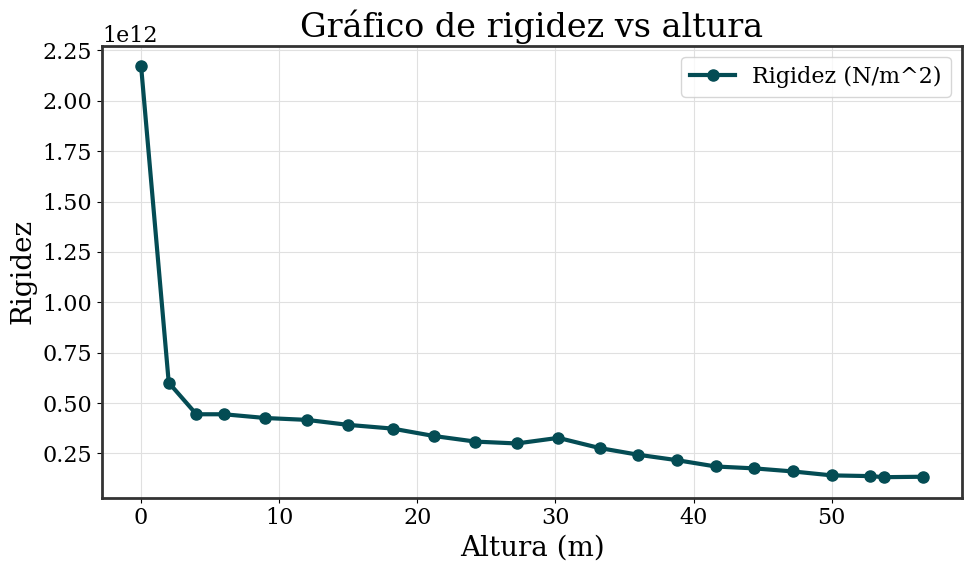
The tower was characterized in 5-metre sections, computing for each height the linear mass and the flexural stiffness from the external radii extracted from the scan and the wall thickness measured by ultrasound. The results show a design that concentrates mass and stiffness at the base (outer radius 1.94 m, thickness 32 mm) and lightens progressively towards the top (radius 1.48 m, thickness 14.4 mm): a classic compromise between structural integrity and material economy.
For the blade, section by section, the linear mass distribution, flapwise (rotor plane) and edgewise (perpendicular) bending stiffness, and torsional stiffness were obtained. The blade —an LM 38.8 model in fibreglass and resin composite— features internal C-shaped reinforcements connecting leading and trailing edges, which were accounted for in the inertia computations of each section.
The bolted flanges between tower segments were modelled as concentrated point masses, adding between 450 and 600 kg at each corresponding height.
Integration and validation
Geometry, aerodynamics, and structural properties were integrated in Bladed, configuring the blade, rotor, tower, drivetrain, nacelle, and control modules. On this model, power production simulations (DLC 1.1 per IEC 61400) were run for wind speeds between 3 and 25 m/s in 1 m/s steps with multiple turbulence seeds.
The simulated power curve was compared against 12 months of real SCADA data from the operating turbine. The calculated curve correctly captures cut-in (3 m/s), rated wind speed (~15 m/s), and the constant-power region.
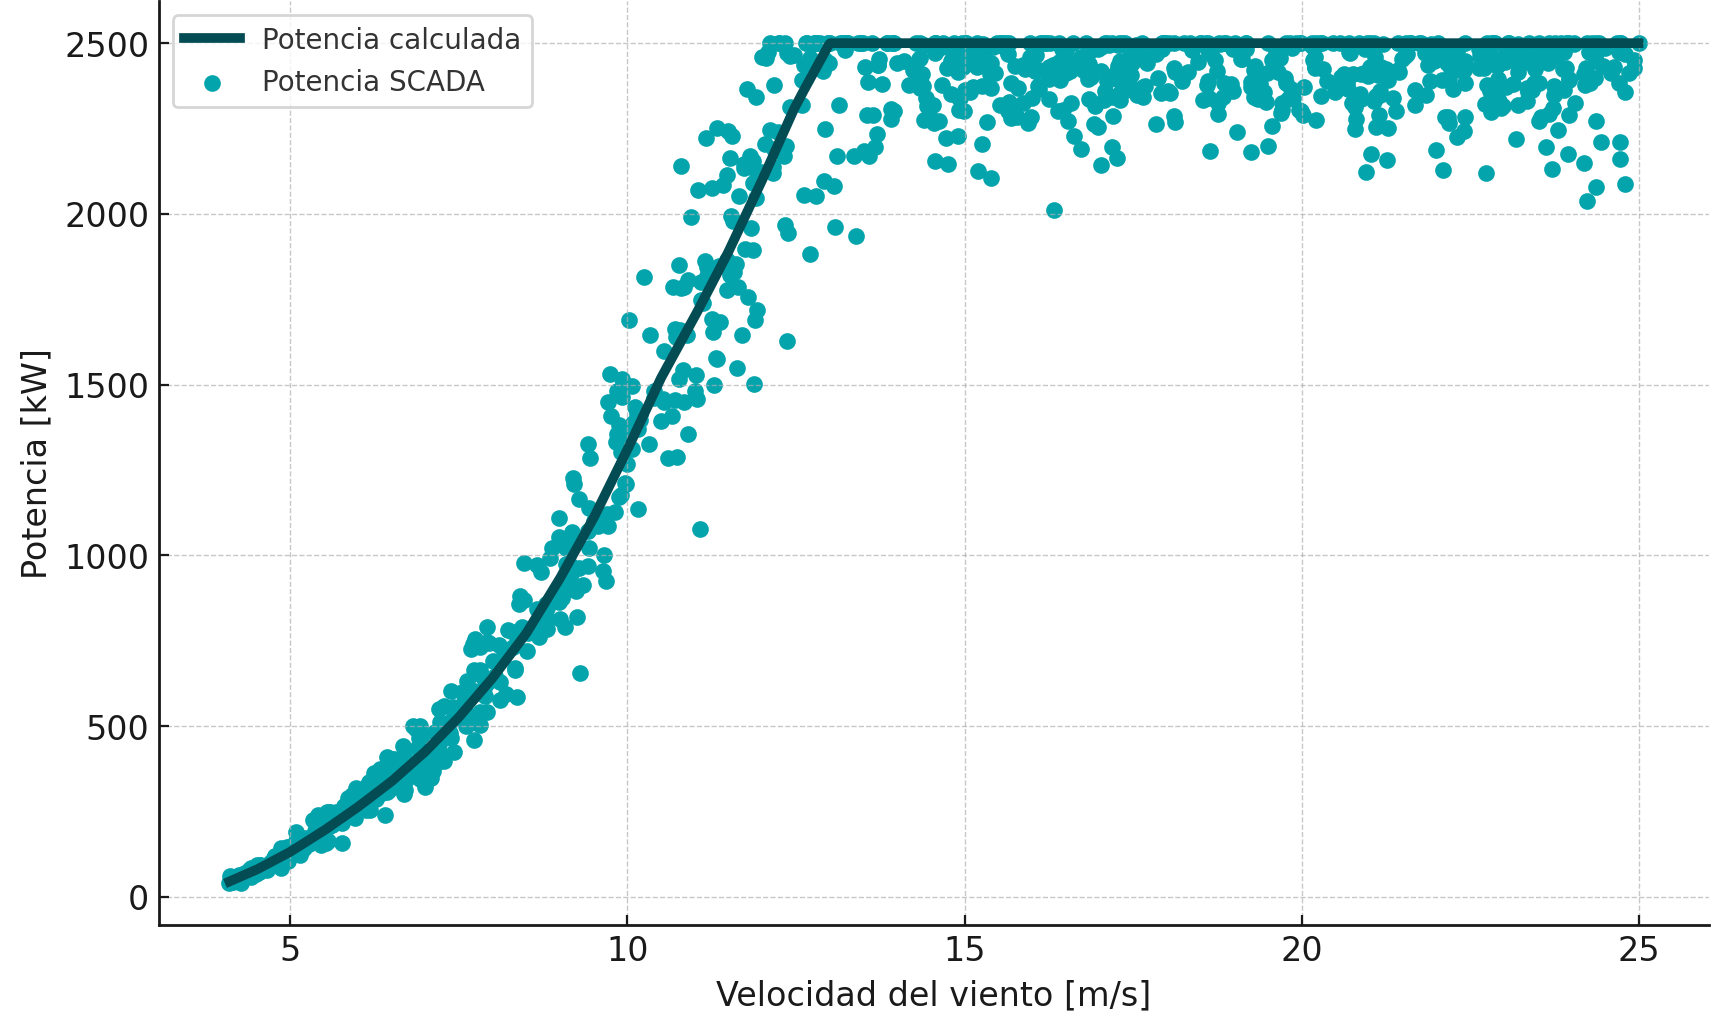
The global error settled at 6.7%, below the 10% threshold set at the outset. The largest discrepancies are concentrated in the transition zone between variable-speed operation and power limiting (11–13 m/s), where the dynamics of the control system are most sensitive. With this accuracy, the model is ready for the next steps: fatigue analysis, remaining-life evaluation, and repowering studies.
Tools used
The workflow combined capture hardware, industry-standard wind energy software, and in-house Python development to automate the repetitive stages and the filtering and fitting algorithms.